Turn Your Messy Spreadsheets Into
Interactive Workspace Dashboards
No expensive subscriptions. No complex tools to learn. Built directly inside your existing Google Sheets.
Visual Operations View (Inside Your Sheet)
Apex Engineering Ltd
£14,500Caledonia Retail Group
£8,200Nexus Health Logistics
£28,000Summit Renewable Energy
£19,400Highland Media Group
£22,000Fortress Logistics Ltd
£35,000The Spreadsheet Trap: Endless Rows & Fragile Formulas
Most growing businesses run on Google Sheets. Over time, those sheets turn into endless rows of text, fragile formulas, and horizontal scrolling marathons.
The Costly SaaS Trap
Force your team into expensive SaaS apps (Airtable, Monday.com, ClickUp) at £15–£30/user/month.
The Reality:
For a team of 10, that is £1,800 to £3,600+ every single year in recurring software overhead, plus weeks of forced staff retraining.
The Fragile DIY Sheet
Build clunky, fragile reports using formulas and charts that break the moment someone touches a cell.
The Reality:
One accidental delete or misaligned pasted row produces #REF! cascades. Team members stop updating data because they are terrified of breaking it.
There Is A Better Way
Keep the Flexibility of Sheets. Gain the Power of Modern Dashboards.
You do not need another software subscription. You just need proper systems architecture applied directly inside the Google Sheet your team already knows how to use.
Interactive Sheets Dashboards
We transform your existing spreadsheets into live, interactive operational control hubs, Kanban boards, and executive dashboards directly inside your Google Sheet.
Two-Way Real-Time Sync
Update a card, change a status, or edit a date directly on the dashboard, and your underlying database updates automatically.
Zero Additional Software Costs
Your team needs no external subscriptions, no third-party logins, and no special software licenses.
Protected & Break-Proof
We lock and protect your underlying formula tabs so your team interacts only through a clean, intuitive visual layout.
From Raw Rows to Live Command Hub
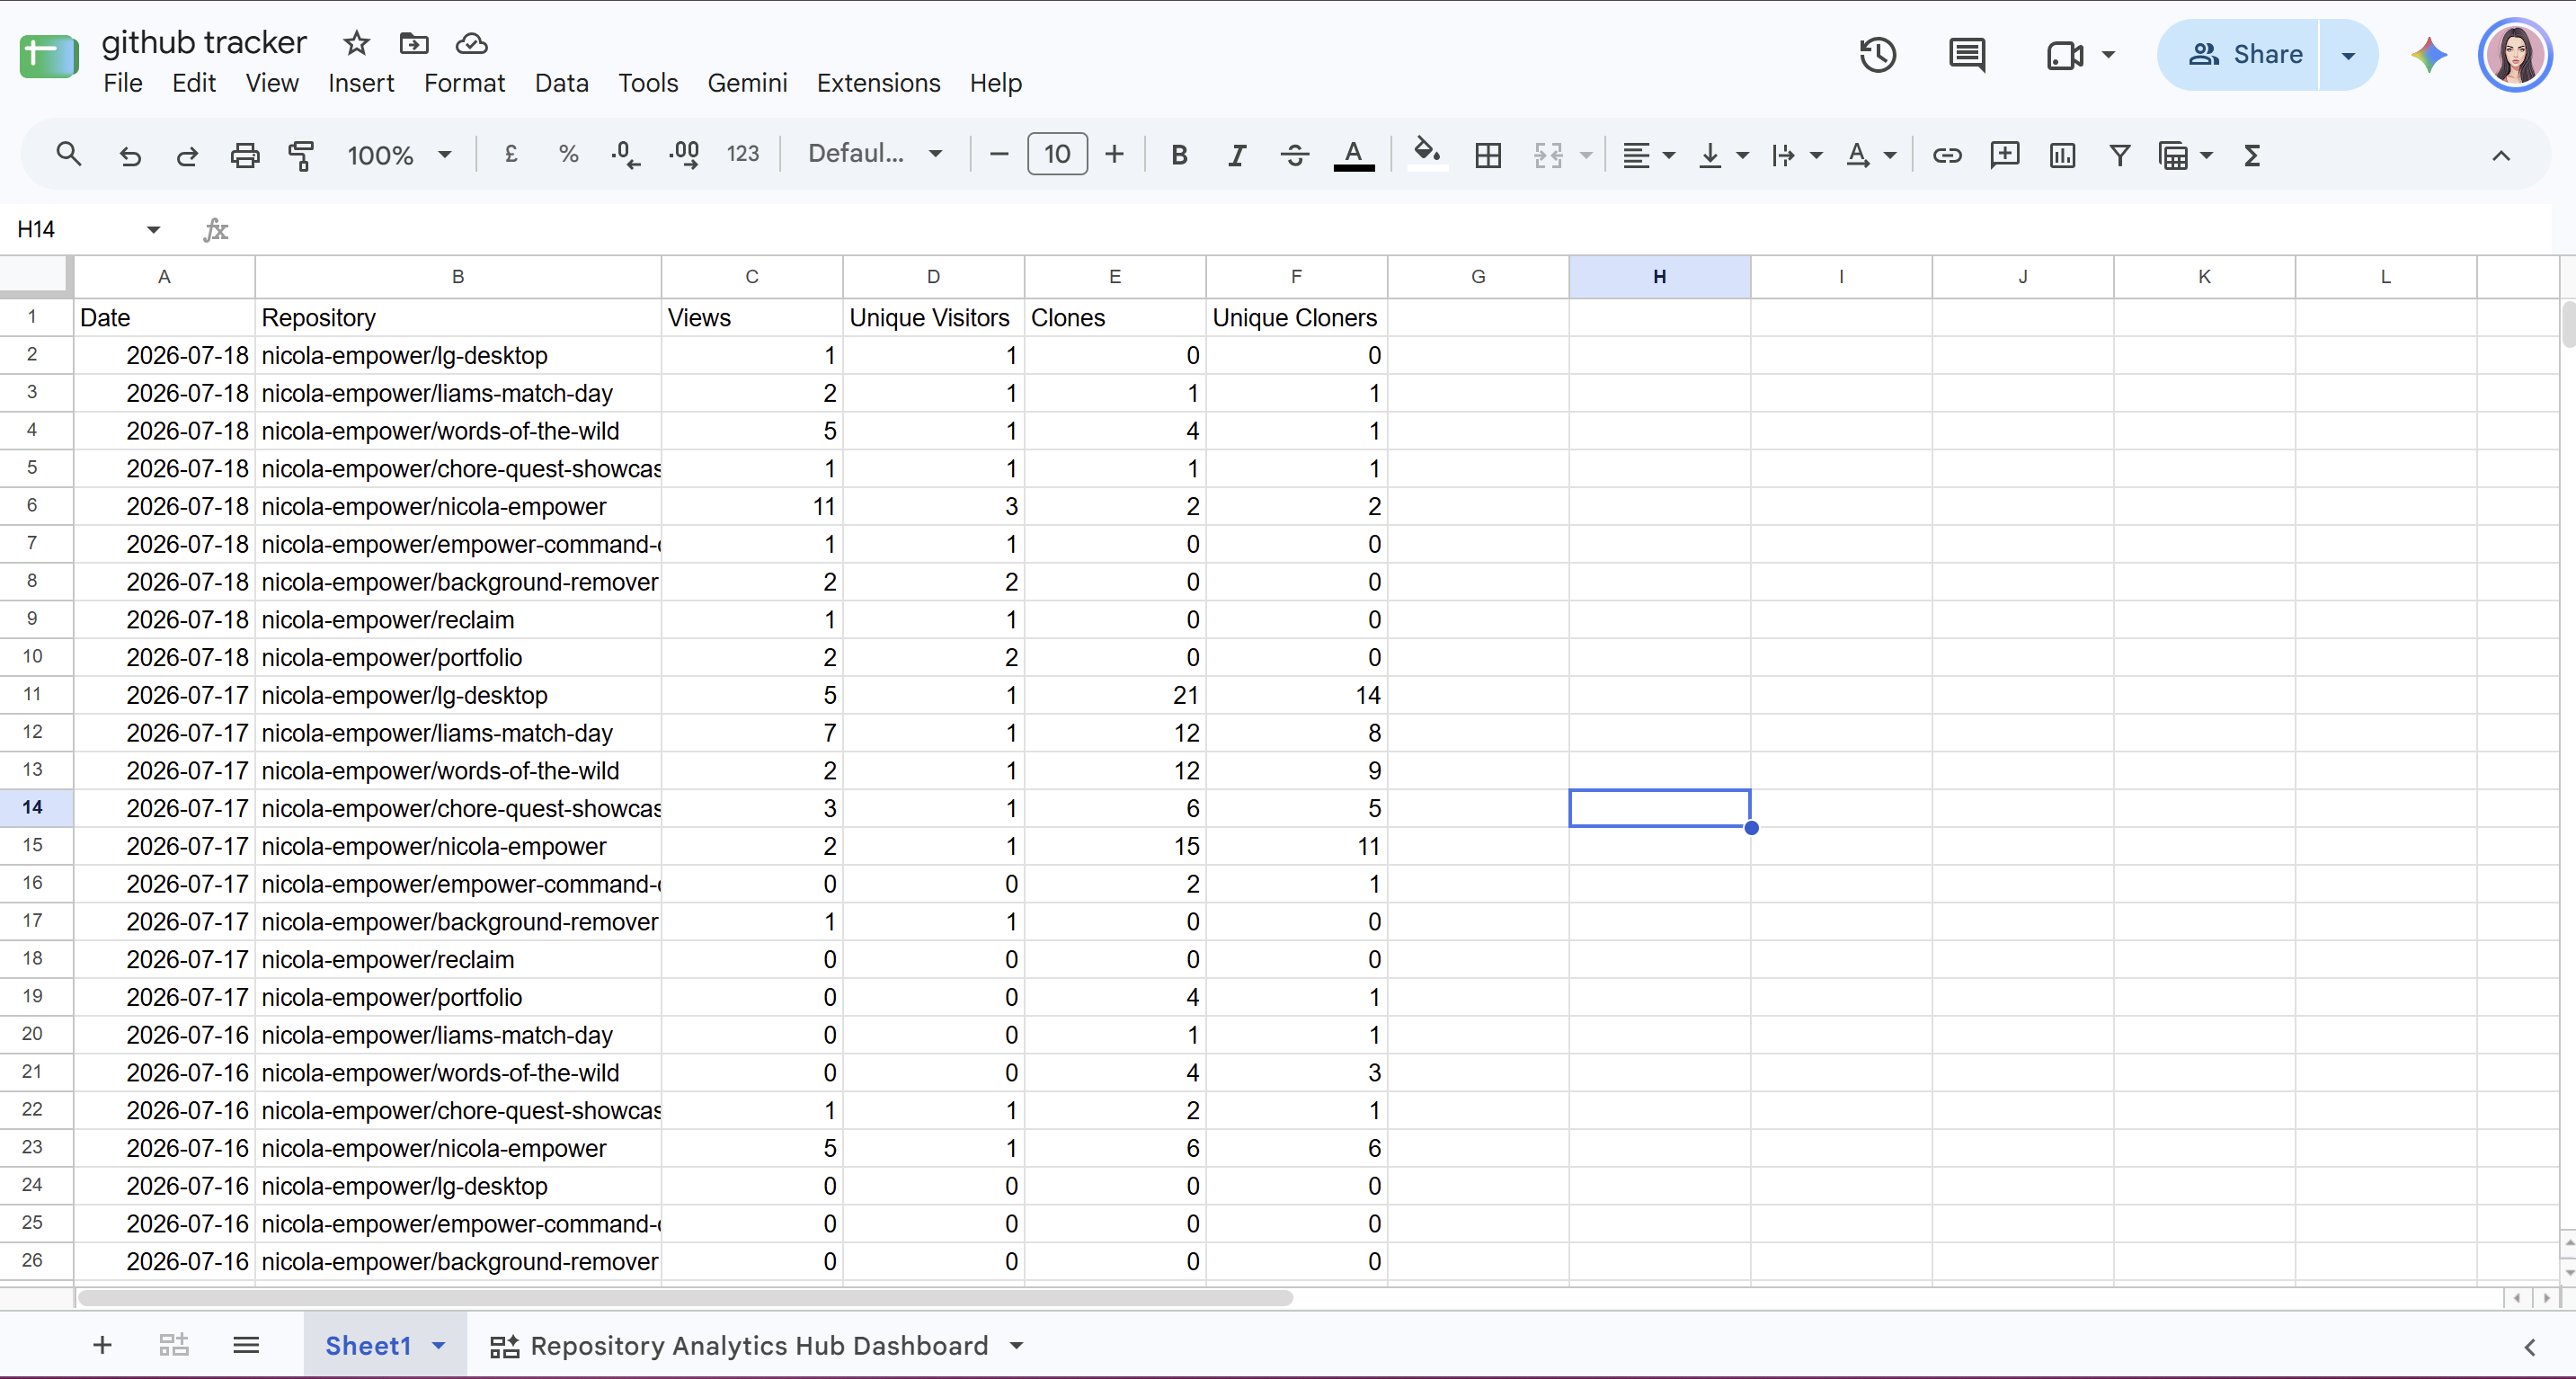
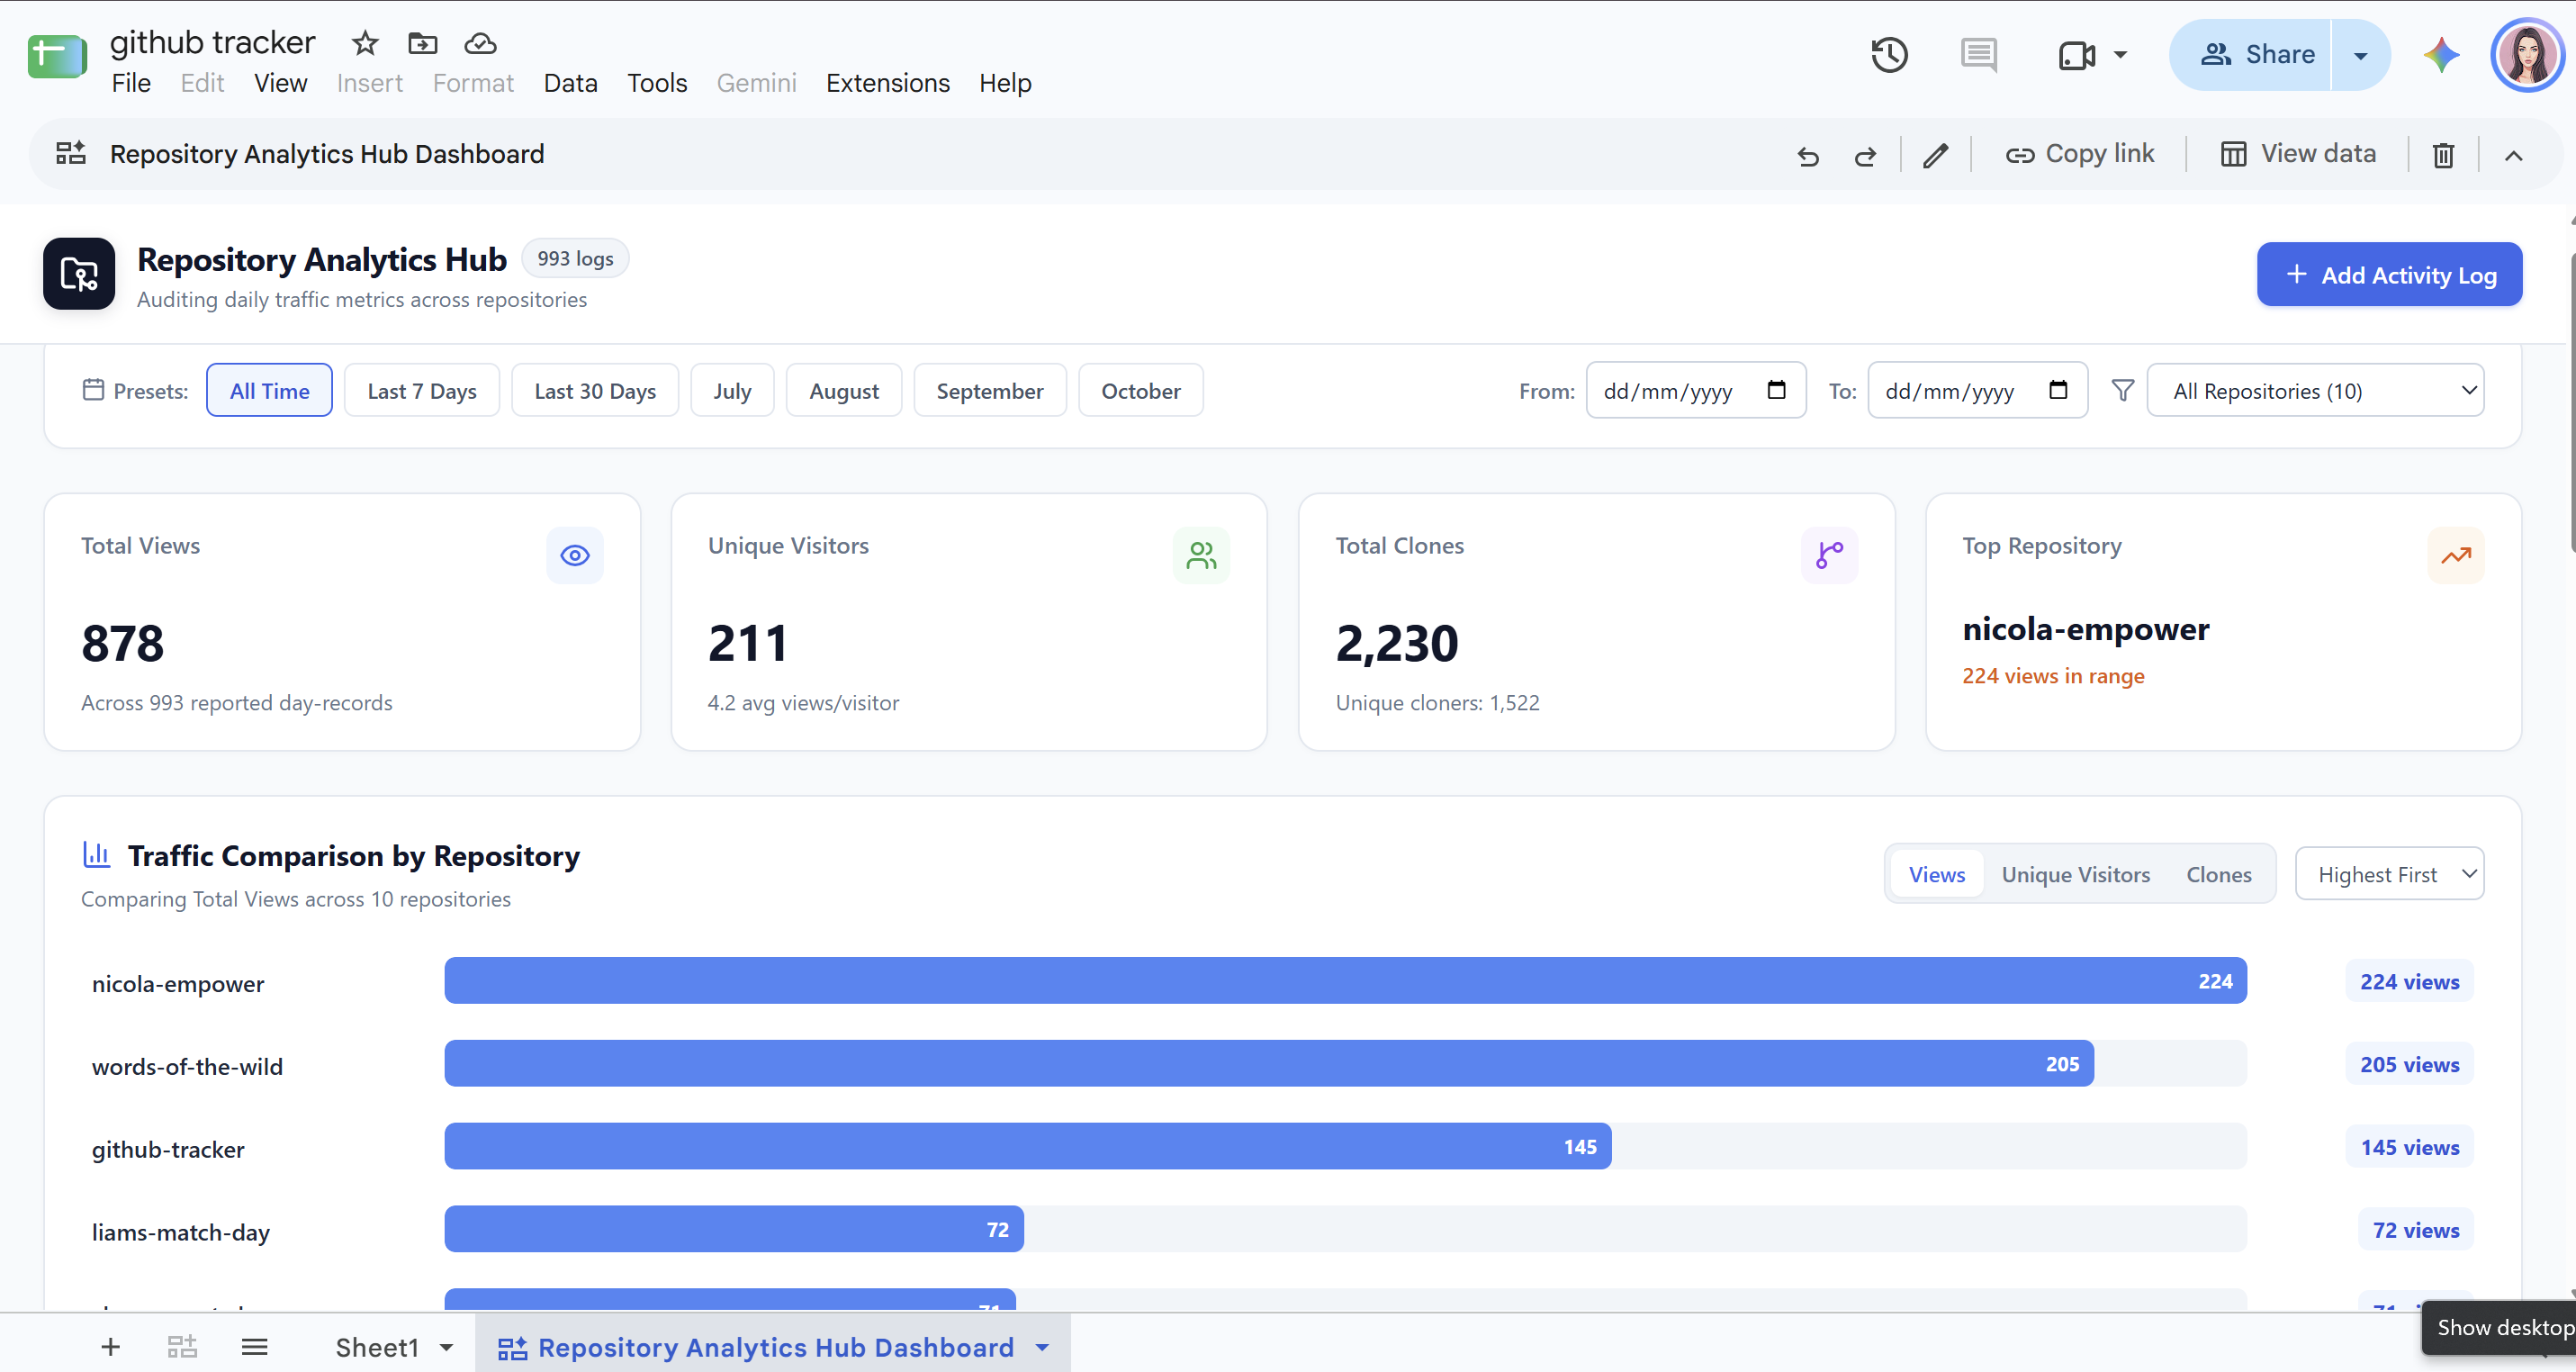
See how an actual client repository tracking spreadsheet transforms into an interactive in-sheet control hub with live filters, date range buttons, and visual cards—all living natively inside the same Google Sheet.
Endless Rows, Columns & Text
Your underlying data stays safe, structured, and familiar. No paying for external database subscriptions or complex cloud SQL servers.
Live Control Hub & Interactive Filters
One click to the dashboard tab gives your team interactive buttons, date range presets (All Time, Last 7 Days, July), KPI scorecards, and live bar charts!
10 Interactive Systems We Build For You
Here are 10 of the most requested dashboard configurations we build for client operations across the UK:
1. Sales & Deal Pipeline
An interactive visual board where deals move smoothly across stages (Lead, Qualified, Proposal Sent, Won, Lost).
Total Pipeline Value, Win Rate, Average Deal Size, and one-click filtering by Account Executive.
2. Client Project & Deliverable Tracker
A card-based delivery board grouping active client milestones by status (Not Started, In Progress, Review, Approved).
Open tasks per team member, upcoming delivery dates, and priority tags.
3. Executive Financial & Revenue Summary
A high-level financial cockpit consolidating messy invoicing or bookkeeping logs into an executive view.
Monthly Recurring Revenue (MRR), Outstanding Invoice Balances, and Year-to-Date Collections.
4. Content Calendar & Editorial Pipeline
An editorial command board organizing content by production stage (Idea, Drafting, Editing, Scheduled, Published).
Publication targets by channel, upcoming scheduled dates, and writer workloads.
5. Agile Task & Sprint Board
An intuitive Kanban board replacing text-heavy to-do lists (Backlog, In Progress, Review, Done).
Active sprint tasks, assignee allocation, and task urgency badges.
6. Customer Support & Ticket Resolution Hub
A customer operations board categorizing incoming support requests by urgency and resolution status.
Open ticket backlog, average resolution turnaround, and issue categories.
7. Inventory & Supply Chain Monitor
A stock management view with automatic visual flags for inventory running below minimum thresholds.
Total SKU counts, reorder alert triggers, and stock levels grouped by supplier.
8. Employee Onboarding & HR Checklists
A candidate and new-hire dashboard tracking individual progress from offer letter to completed onboarding.
Active hires in progress, pending compliance documents, and departmental breakdown.
9. Marketing & Campaign Performance Hub
A marketing dashboard aggregating cross-channel campaign data into clean performance scorecards.
Cost per acquisition, total impressions, click-through rates, and engagement by platform.
10. Operations & System Health Monitor
A centralised operations dashboard monitoring service uptime, repository activity, or automated sync health.
Active vs. errored services, last-ping timestamps, and daily usage volume trends.
Available Packages & Pricing
Fixed pricing. Fast turnaround. Zero subscription lock-in. You own and control your Google Sheet forever.
Single Dashboard Sprint
Transform one core operational sheet into a clean visual interface.
What’s Included:
The Operations Hub Build
Transform your entire multi-tab workflow into a connected command center.
What’s Included:
Custom Retainer
Ongoing dashboard maintenance, automation pipelines, and monthly reporting.
What’s Included:
How It Works in 3 Simple Steps
No lengthy migration projects or steep learning curves. We work directly with what you already have.
Share Your Sheet
Send us your existing Google Sheet. We conduct a quick structural audit and identify the ideal views and metrics for your team's workflow.
We Clean & Build
We clean up your database, normalise your tables, lock formula ranges to prevent accidental edits, and build your interactive dashboard interface.
Launch & Handover
We hand back your transformed sheet with a walkthrough document so your team can start using it immediately with zero confusion.
Frequently Asked Questions
Everything you need to know about Google Sheets workspace transformation.
Does this require any third-party tools or external accounts?
No. Everything runs natively within your existing Google Sheet using standard Google Workspace permissions, data validation, and built-in formulas or Apps Script. There are zero subscriptions, zero seat fees, and zero external logins required.
How do you stop team members from breaking formulas?
We configure Google Sheets protected ranges and permission rules. Your raw calculation formulas and source database tabs are locked into read-only states, so your team interacts only with designated visual input cards, drop-downs, and controls.
Can we connect Google Forms or automated inputs into the dashboard?
Yes! In Tier 2 and Tier 3 packages, we frequently integrate incoming Google Forms, Zapier webhooks, Stripe payment triggers, or CRM webhooks to populate new items into the underlying database instantly.
How do we share the sheet with you to get started?
You simply share 'Editor' access to your existing Google Sheet (or a duplicate copy with sensitive customer details obfuscated). We conduct a fast structural audit and deliver the revamped dashboard in 24 to 48 hours for Sprint packages.
Comparison: Interactive Sheets Dashboard vs. Custom Web App
Not sure whether your business needs an interactive Google Sheet or a completely standalone custom web application? Here is a simple, practical comparison to help you choose the right fit.
Quick Decision Guide
You want a fast, affordable internal tool for your team, your current workflow lives in Google Drive, and you do not want recurring server or hosting fees.
You need an external client-facing portal with separate customer logins, public access on your own domain, custom payment gateways, or highly bespoke branding.
Interactive Sheets Dashboard
Your database and visual controls stay inside Google Sheets.
Pros:
- Ready in Days, Not Weeks: Quick setup with minimal turnaround time.
- Zero Infrastructure Overhead: No hosting bills, database maintenance, or server configurations.
- Familiar for Your Team: Everyone already knows how to use Google Drive and Sheets.
- Easy In-House Tweaks: You own your underlying spreadsheet and can add notes or rows anytime.
Cons:
- Built for Internal Teams: Not suitable for giving external clients their own private accounts or logins.
- Design Boundaries: Uses Google's standard layout styles rather than pixel-perfect custom branding.
- Data Volume Limits: Best suited for hundreds to tens of thousands of rows, rather than millions of records.
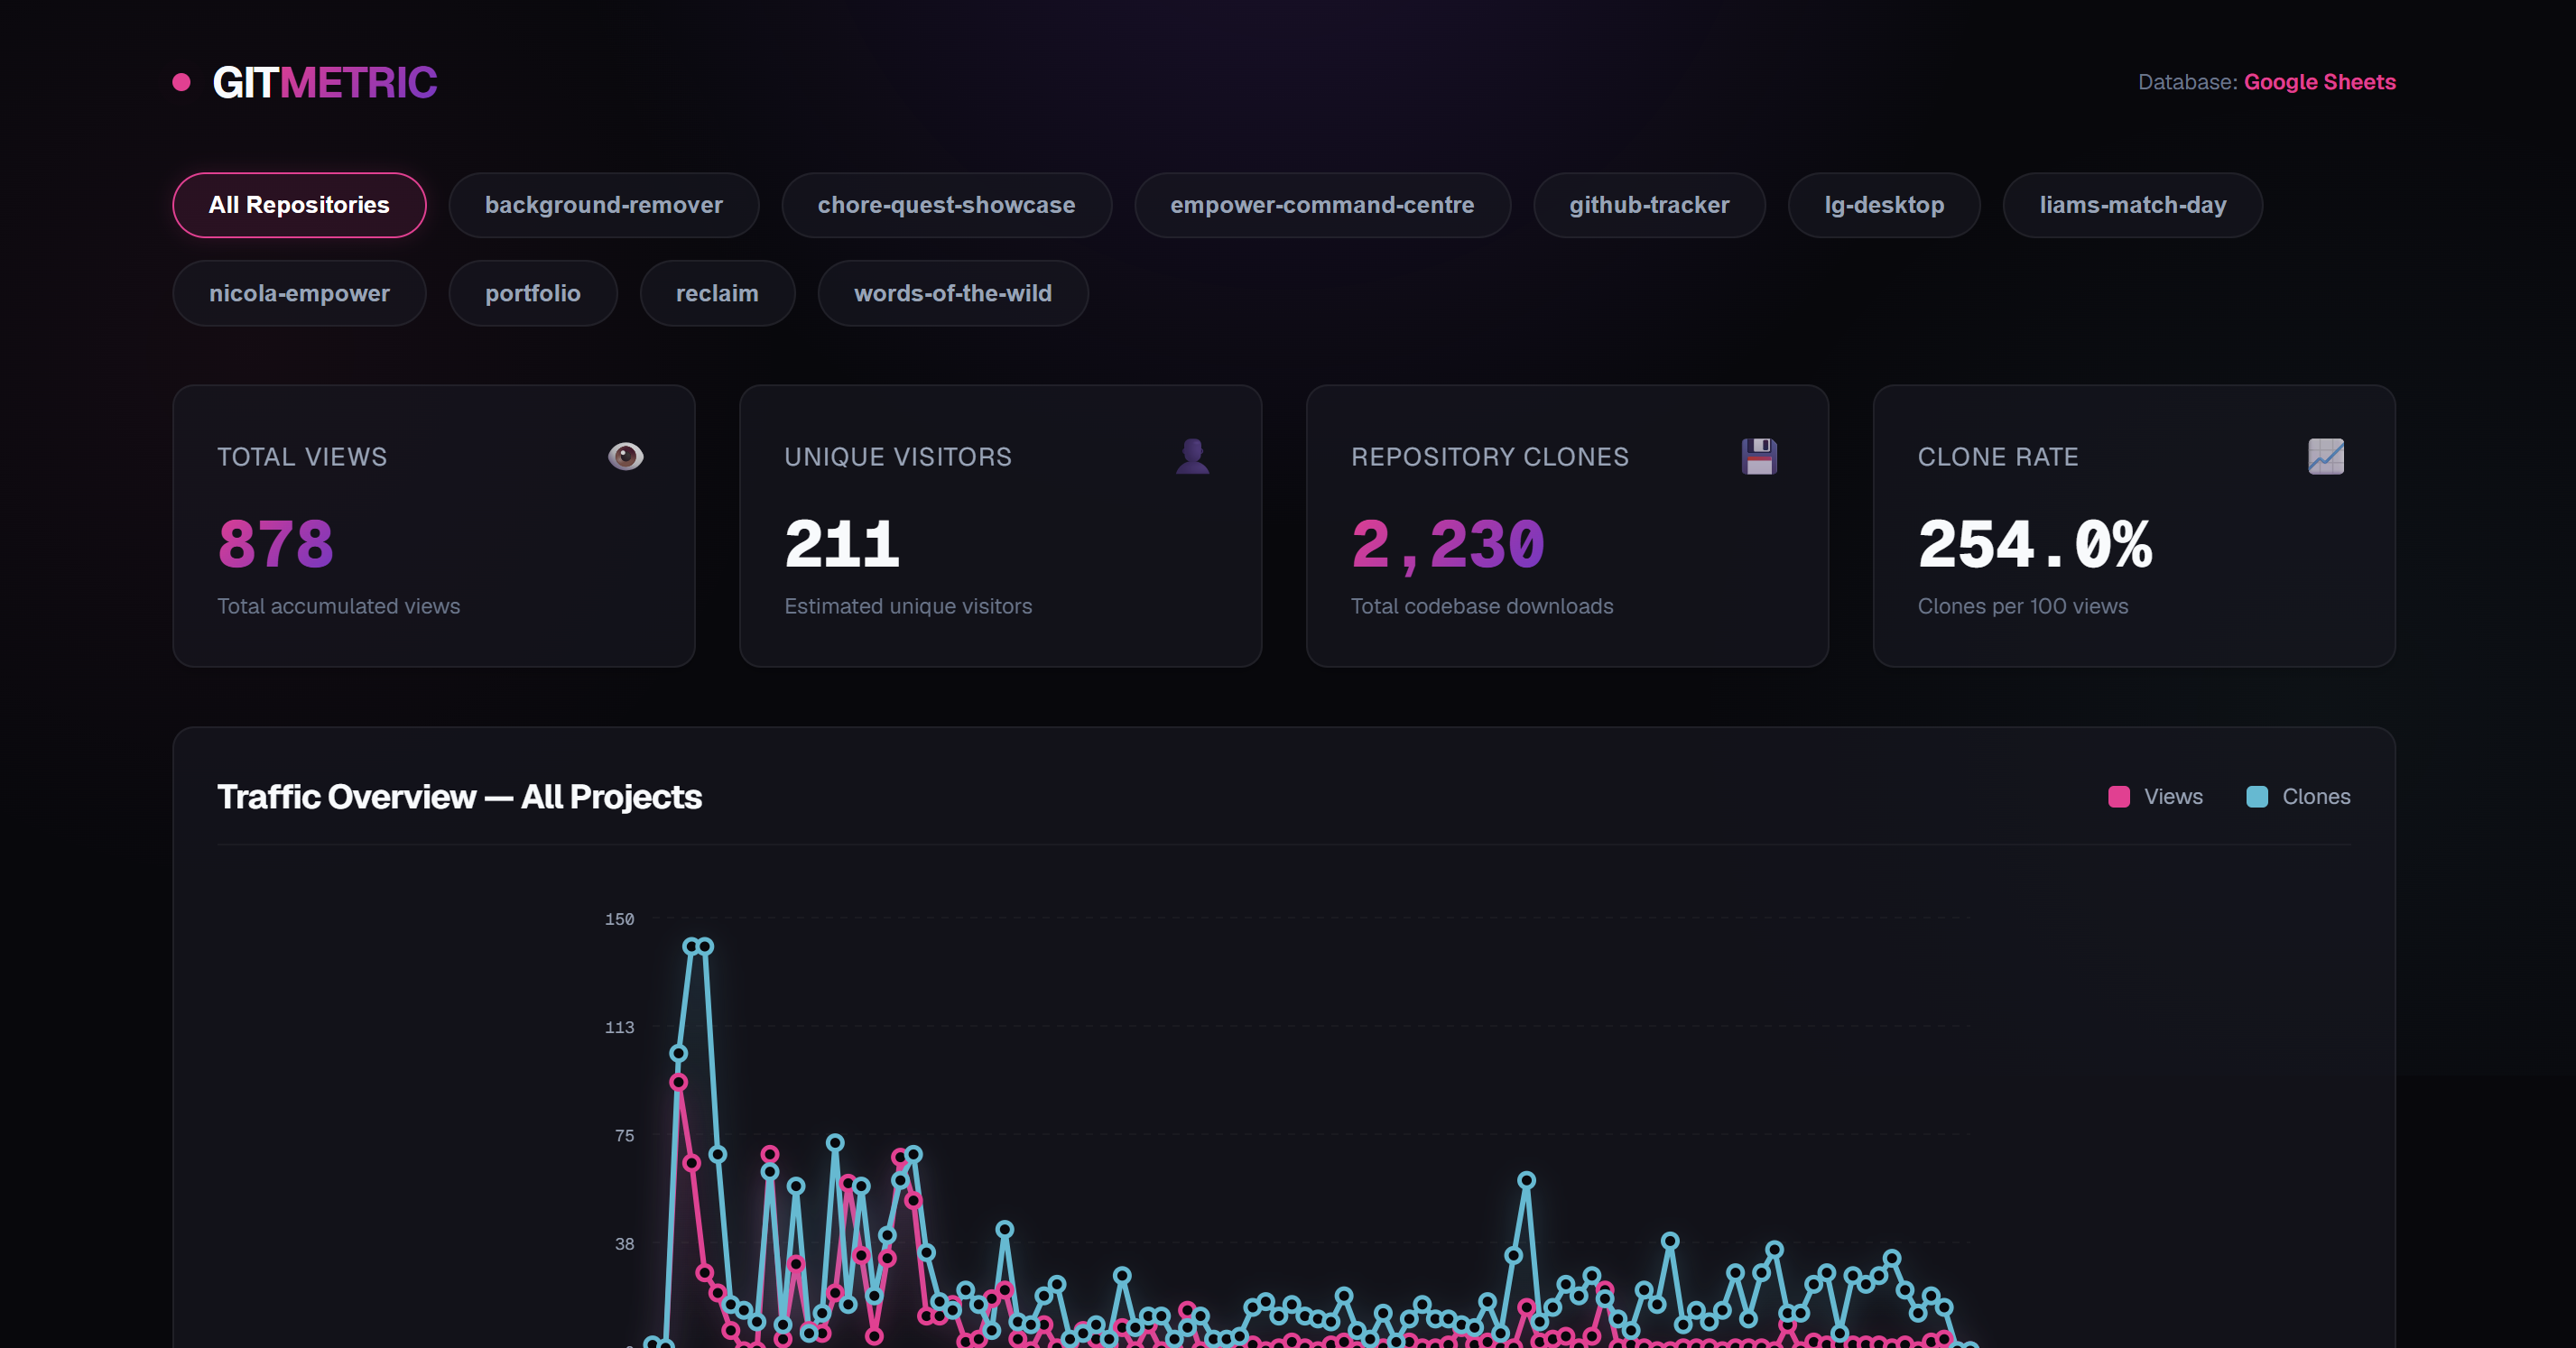
Custom Web Application
A standalone software portal built from scratch (e.g., custom modern web build).
Pros:
- Complete Design & Brand Freedom: Tailored look, typography, colour schemes, and bespoke user experiences.
- Granular User Roles & Client Portals: Clients log in securely and only see their own private data.
- Complex Features & Integrations: Connect customer payment flows, public search pages, and multi-database architectures.
- Scales to Massive Datasets: Handles high-volume traffic and hundreds of thousands of entries smoothly.
Cons:
- Higher Investment: Costs significantly more in initial development time and budget.
- Ongoing Maintenance: Requires hosting plans, domain upkeep, and occasional software dependency updates.
- Longer Launch Timeline: Involves design mockups, front-end and back-end architecture, testing, and deployment.
Ready to Turn Your Messy Sheets Into a Command Centre?
Share your sheet today. We will audit its structure, eliminate formula vulnerabilities, and give you an interactive workspace your team will love.